Portfolio insights
Understand your portfolio's diversification, sector exposure, and asset class breakdown with automated scoring and visual charts.
Portfolio insights give you an automated assessment of how well-diversified your portfolio is, with scores for diversification, sector exposure, and asset class breakdown.
What are portfolio insights?
Insights analyse your holdings and assign scores based on how concentrated or diversified your portfolio is across three dimensions:
- Diversification — How evenly your capital is spread across holdings
- Sector exposure — How balanced your portfolio is across industry sectors
- Asset class breakdown — How your portfolio is distributed across asset classes (stocks, ETFs, crypto, metals)
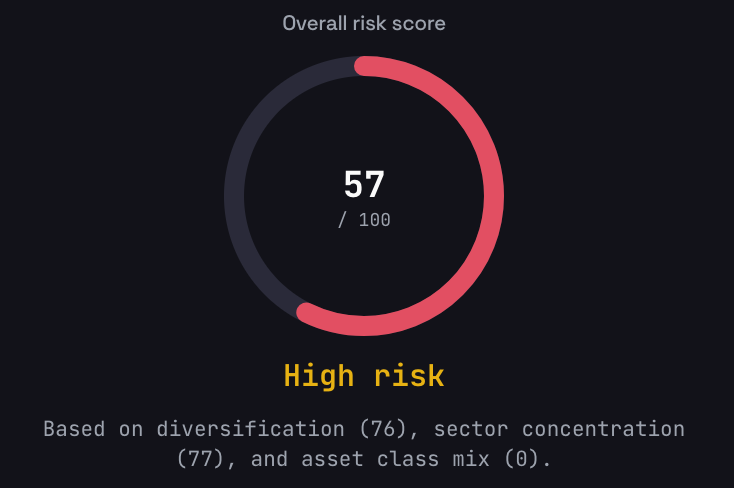
Each dimension gets a score, and these combine into an overall risk score.
Accessing insights
- Open any portfolio
- Navigate to the Insights tab in the portfolio menu
- Review your overall score and the individual breakdowns
Understanding the risk score
The overall risk score ranges from 0 to 100:
| Score | Rating | Meaning |
|---|---|---|
| 80-100 | Excellent | Well-diversified across holdings, sectors, and asset classes |
| 60-79 | Good | Reasonably diversified with room for improvement |
| 40-59 | Fair | Noticeable concentration in some areas |
| 0-39 | Poor | Highly concentrated, consider diversifying |
A higher score means your portfolio is more diversified and less exposed to concentration risk.
Score breakdown
Diversification score
Measures how evenly your capital is spread across individual holdings.
- A portfolio with one holding dominating 80% of the value scores low
- A portfolio with holdings spread more evenly scores high
- This score rewards having multiple positions without any single one being too dominant
Sector score
Measures how balanced your portfolio is across industry sectors (technology, healthcare, financials, etc.).
- Heavy concentration in one sector (e.g., 90% technology) scores low
- Exposure across multiple sectors scores high
- Sector data comes from stock classification data
Asset class score
Measures the distribution across different asset classes.
- A portfolio with only one asset class scores lower
- Mixing stocks, ETFs, crypto, and metals improves this score
- This encourages broad asset class diversification
Charts
The insights page includes visual charts to help you understand your portfolio composition:
- Sector allocation chart — Shows the percentage breakdown by sector
- Asset class chart — Shows the split between stocks, ETFs, crypto, metals, and other assets
- Top holdings — Highlights your largest positions and their weight in the portfolio
Excluding assets from insights
Some holdings may not be relevant to your diversification analysis (e.g., cash equivalents or very small positions). Holdings below a minimum threshold are automatically excluded from scoring to prevent dust positions from skewing results.
Tips for improving your scores
- Diversification — Avoid letting any single holding exceed 20-25% of your portfolio
- Sector exposure — If one sector dominates, consider adding holdings from other sectors
- Asset class — Consider whether adding a different asset class (metals, crypto) fits your strategy
- Regular review — Check insights periodically, especially after adding new positions
Note: A perfect score isn't always the goal. Your allocation should reflect your investment strategy and risk tolerance. Insights help you understand your exposure, not dictate what to buy.
Related features
- Reading your portfolio charts — Understand your portfolio's visual breakdowns
- Portfolio rebalancing — Use rebalancing to adjust your allocation
- ETF holding overlap — Check if your ETFs duplicate each other