ETF holding overlap
Find out which holdings your ETFs share and how much they overlap, with interactive Sankey diagrams and detailed breakdowns.
ETF holding overlap shows you which underlying stocks your ETFs share, helping you avoid unintentional concentration when holding multiple ETFs.
What is ETF overlap?
When you own multiple ETFs, they often hold the same underlying stocks. For example, a US total market ETF and a large-cap growth ETF might both hold Apple, Microsoft, and other large companies. This means you may have more exposure to certain stocks than you realise.
The ETF overlap tool analyses the underlying holdings of your ETFs and shows you exactly where they overlap.
Accessing the overlap page
- Open the main menu
- Navigate to ETF overlap
- Select which ETFs to compare
The tool works with any ETFs in your portfolio that have underlying holding data available.
Overlap summary
The summary section shows:
- Number of shared holdings — How many stocks appear in more than one of your ETFs
- Overlap percentage — The weighted overlap between each pair of ETFs
- Unique holdings — Stocks that only appear in one ETF
This gives you a quick view of how much duplication exists across your ETF holdings.
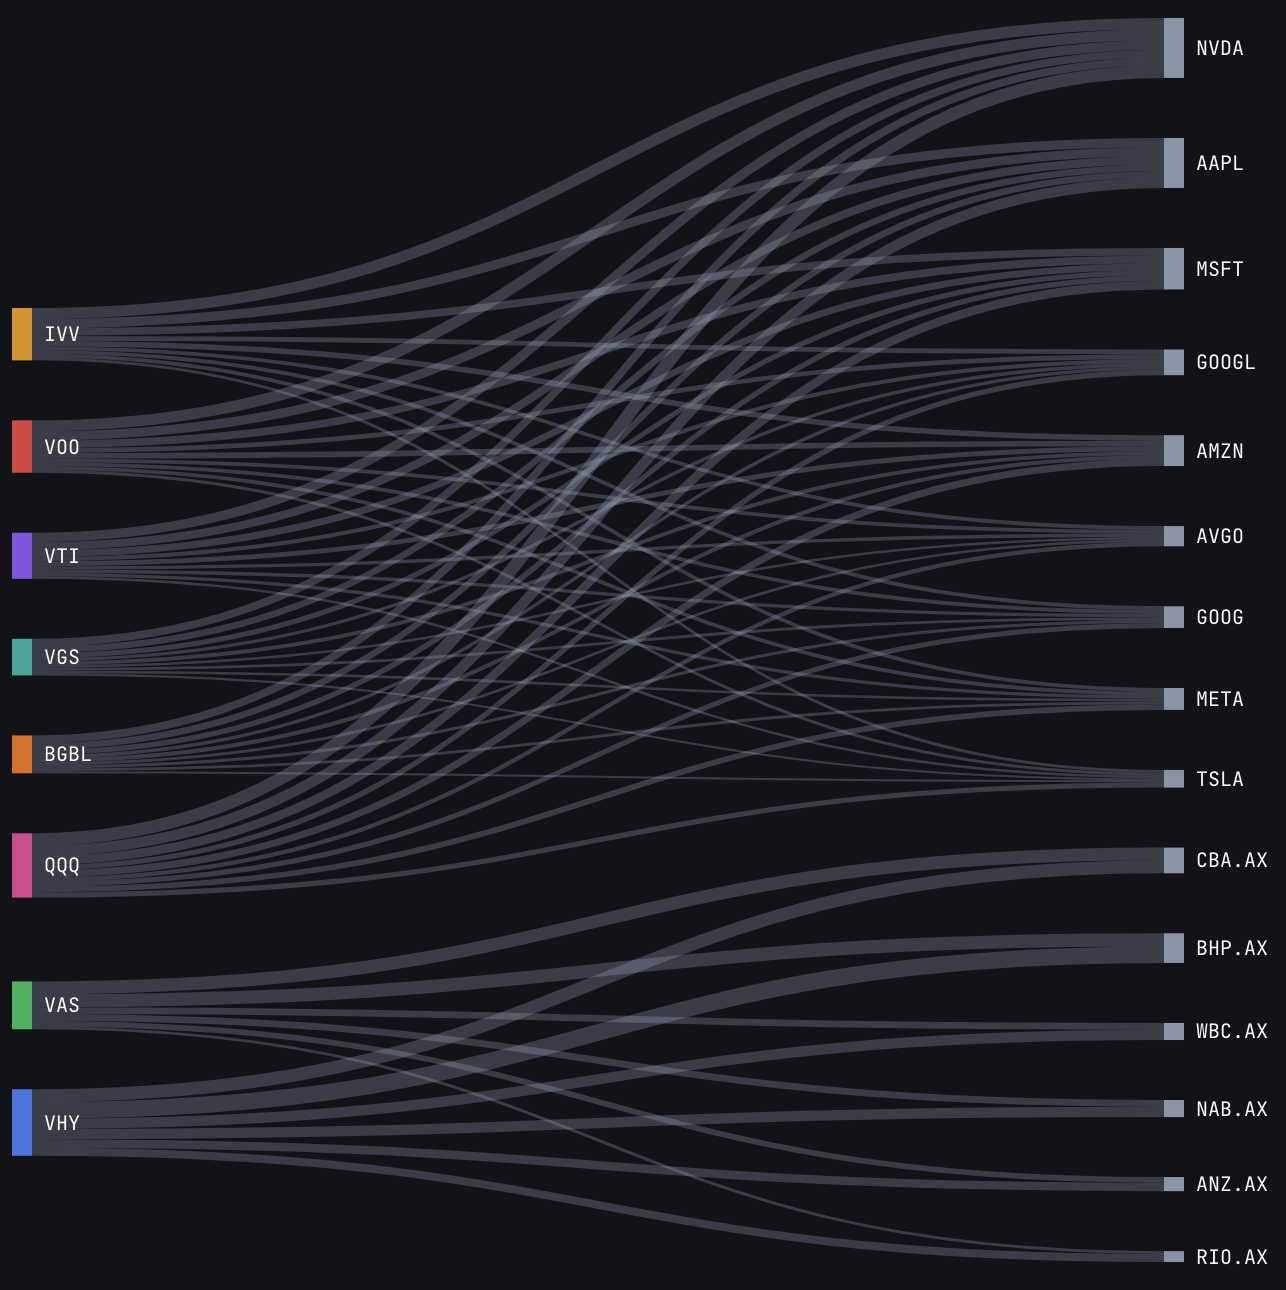
Sankey diagram
The interactive Sankey diagram visualises the flow of holdings between your ETFs:
- Each ETF appears as a node on the left
- Shared underlying holdings appear as nodes on the right
- The width of each connection represents the weight of that holding in the ETF
- Hover over connections to see exact percentages
The diagram makes it easy to spot which holdings create the most overlap between your ETFs.
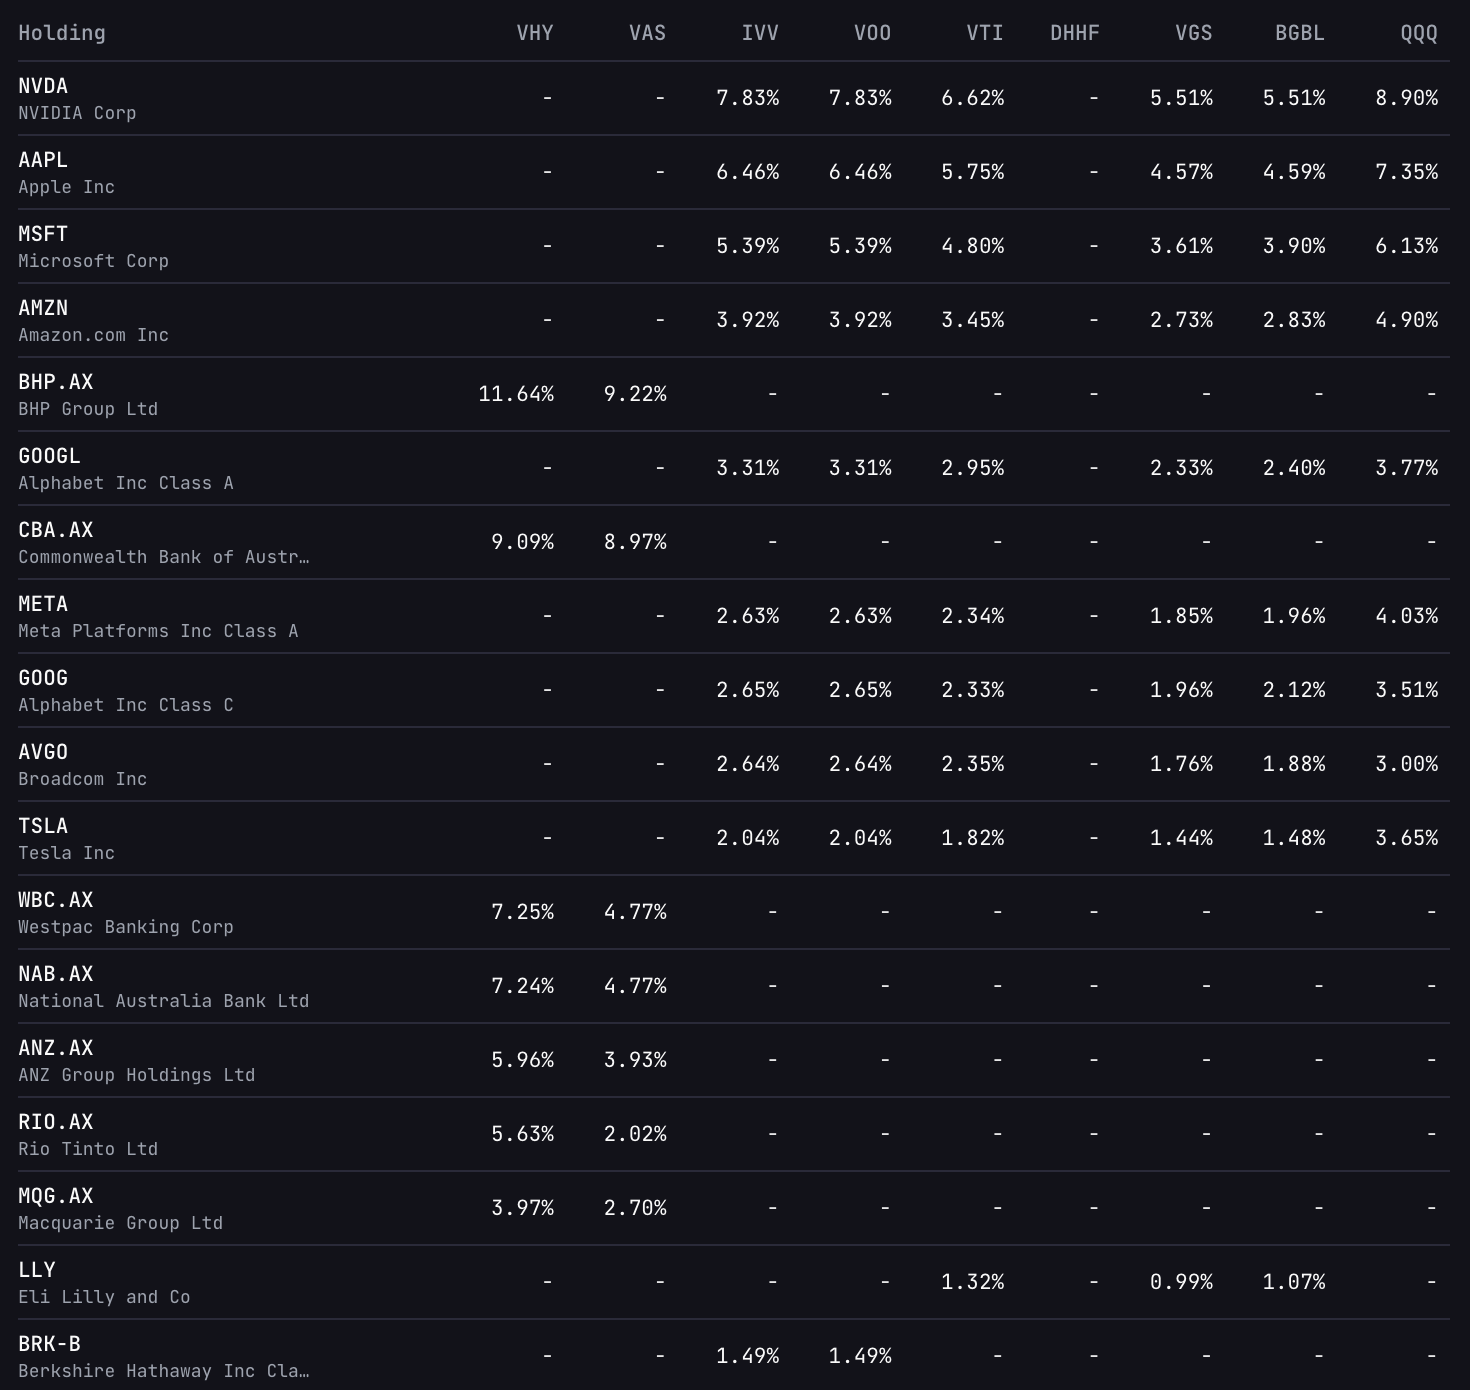
Shared holdings table
Below the diagram, a detailed table lists every shared holding:
| Column | Meaning |
|---|---|
| Holding | The underlying stock or asset |
| ETFs | Which of your ETFs contain this holding |
| Weight | The percentage weight in each ETF |
Sort by weight to find the holdings with the largest combined exposure.
What the percentages mean
- Weight in ETF — The percentage of that ETF allocated to the stock (e.g., Apple at 7% of VTI means 7% of VTI's value is in Apple)
- Overlap percentage — The total percentage of shared holdings between two ETFs, weighted by their allocations
A high overlap percentage (e.g., 60%+) between two ETFs means they largely duplicate each other's exposure.
Tips for reducing overlap
- Review before buying — Check overlap with existing ETFs before adding a new one
- Choose complementary ETFs — Pair ETFs that cover different segments (e.g., US large-cap with international small-cap)
- Consider individual stocks — If you want specific exposure, buying the stock directly avoids ETF overlap
- Simplify — Sometimes one broad ETF provides better diversification than multiple overlapping ones
Example: If VTI and QQQ overlap by 40%, nearly half of QQQ's holdings are already in VTI. You might get similar exposure by increasing your VTI position instead.
Related features
- Portfolio insights — Review your overall diversification scores
- Reading your portfolio charts — Understand allocation breakdowns
- Portfolio rebalancing — Adjust your portfolio based on overlap findings