ETF comparison tool
VOO vs VTI
Vanguard S&P 500 ETF vs Vanguard Total Stock Market Index Fund ETF Shares
ETF comparison
| VOO | VTI | |
|---|---|---|
| Fund name | Vanguard S&P 500 ETF | Vanguard Total Stock Market Index Fund ETF Shares |
| Annual fee | 0.03%Lowest fee | 0.03% |
| Dividend frequency | Quarterly | Quarterly |
| Annualised returns | VOO | VTI |
| YTD | 0.67% | 1.05% |
| 1 year | 16.95% | 17.04% |
| 3 year | 21.77% | 20.92% |
| 5 year | 14.15% | 12.68% |
| 10 year | 15.46% | 15.04% |
| Dividend yield history | VOO | VTI |
| 2025 | 1.13% | 1.12% |
| 2024 | 1.26% | 1.29% |
| 2023 | 1.50% | 1.48% |
| 2022 | 1.77% | 1.74% |
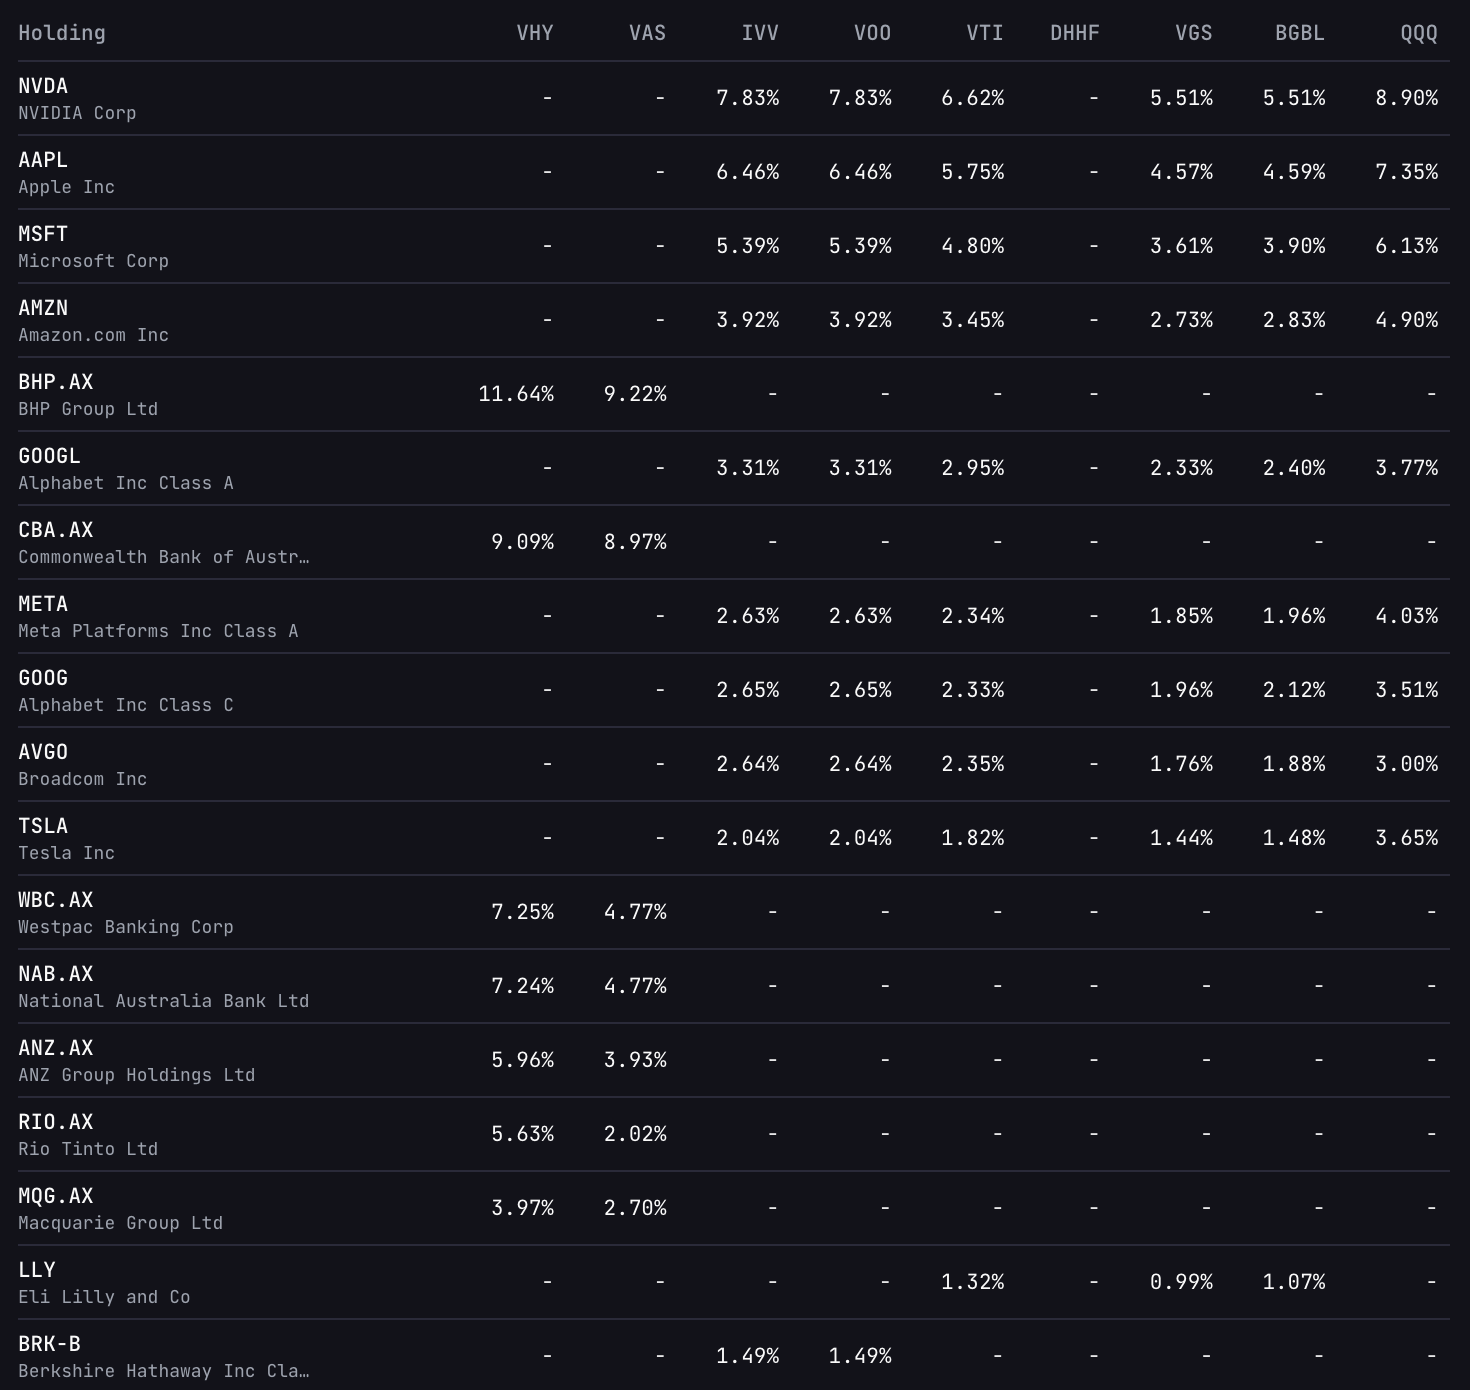
| Top holdings | VOO | VTI |
| NVDA | 7.31% | 6.17% |
| AAPL | 6.63% | 5.89% |
| MSFT | 4.96% | 4.40% |
| AMZN | 3.47% | 3.05% |
| GOOGL | 3.08% | 2.74% |
| AVGO | 2.56% | 2.28% |
| GOOG | 2.46% | 2.16% |
| META | 2.40% | 2.13% |
| TSLA | 1.92% | 1.72% |
| BRK-B | 1.57% | 1.37% |
| Sector allocation | VOO | VTI |
| Technology | 33.1% | 31.1% |
| Financial Services | 12.1% | 12.4% |
| Communication Services | 10.8% | 9.9% |
| Healthcare | 9.9% | 10.4% |
| Consumer Cyclical | 10.1% | 10.1% |
| Industrials | 8.7% | 10.2% |
| Consumer Defensive | 5.4% | 5.1% |
| Energy | 3.5% | 3.6% |
| Utilities | 2.5% | 2.5% |
| Real Estate | 2.0% | 2.5% |
| Basic Materials | 1.9% | 2.2% |
ETF data is based on the most recent available holdings from fund providers. Only the top holdings are compared, so actual overlap may differ. Annualised returns are trailing figures and do not guarantee future performance. This is not financial advice.
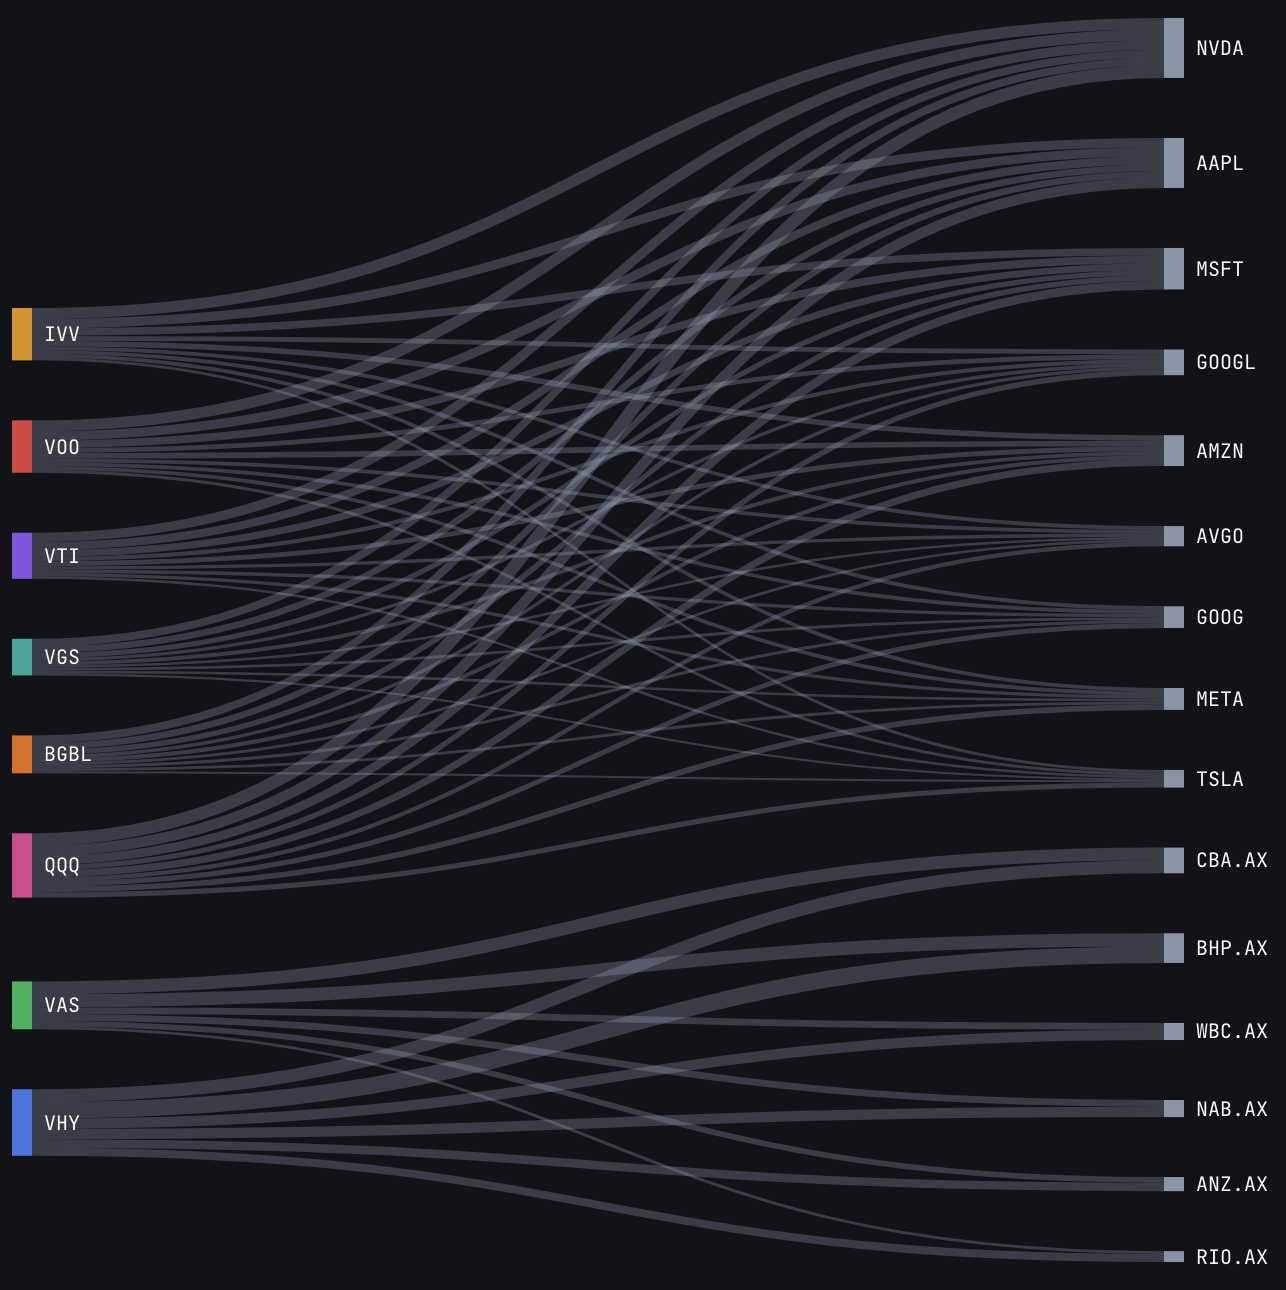
See the overlap across all your ETFs in the same place
Add up to 20 holdings for free and see how your ETFs overlap together, with interactive Sankey diagrams and shared holdings breakdowns. Need more? The Pro plan gives you unlimited holdings, plus tax reports, automatic transaction tracking via email forwarding, and dividend calendars.